

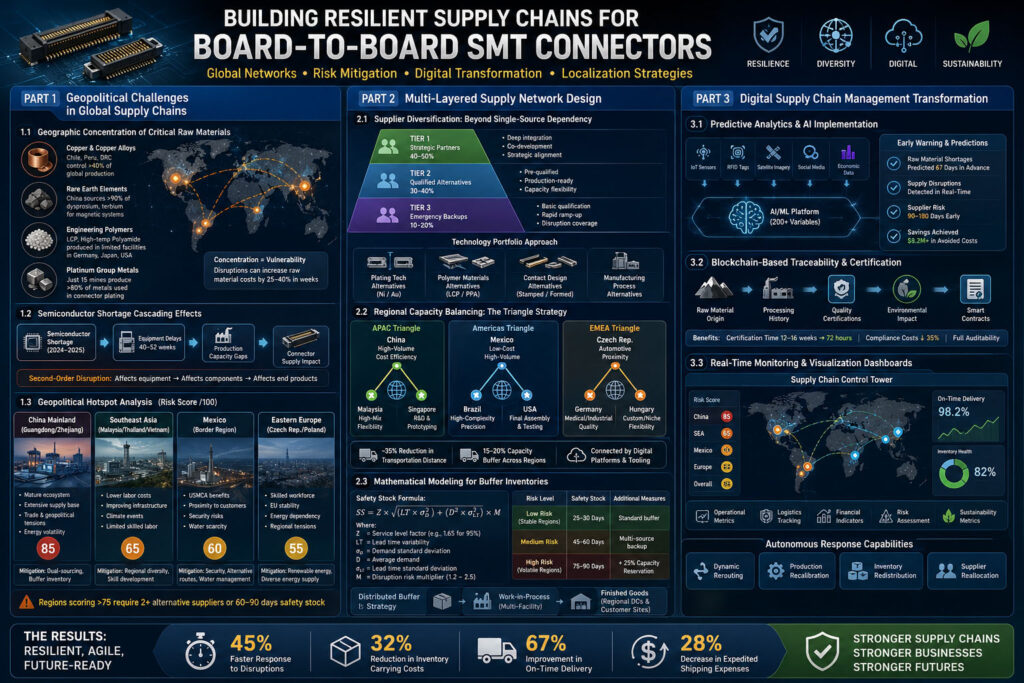
Board-to-Board SMT Connector Supply Chain Resilience: Global Networks, Risk Mitigation, and Localization Strategies
Part 1: Geopolitical Challenges in Global Supply Chains
In today’s interconnected electronics manufacturing ecosystem, Board-to-Board SMT connectors exist at the convergence point of multiple global supply chains. What was once a routine procurement process has transformed into a complex strategic exercise in geopolitics, resource allocation, and risk management.
1.1 Geographic Concentration of Critical Raw Materials
The journey of a Board-to-Board SMT connector begins with raw materials whose availability often depends on geopolitically sensitive regions. Consider the material composition of a typical automotive-grade connector:
– **Copper and Copper Alloys**: Chile, Peru, and the Democratic Republic of Congo collectively control over 40% of global copper production. Supply disruptions in any of these regions can increase raw material costs by 25-40% within weeks.
– **Rare Earth Elements**: Dysprosium and terbium used in high-performance magnetic latching systems in connectors are almost exclusively sourced from China (over 90% of global production). This concentration creates significant supply chain vulnerability.
– **Advanced Engineering Polymers**: Specialized liquid crystal polymers (LCP) and high-temperature polyamide resins essential for automotive applications are produced in limited facilities across Germany, Japan, and the United States. Production capacity constraints in any of these locations create immediate bottlenecks.
A 2025 industry analysis revealed that just 15 mines worldwide produce over 80% of the platinum group metals used in connector plating. This geographic concentration means that natural disasters, political instability, or trade restrictions in a single region can paralyze global connector manufacturing.
1.2 Semiconductor Shortage Cascading Effects
While connector manufacturers don’t produce semiconductors, they rely heavily on the semiconductor industry for:
– **Advanced manufacturing equipment**: Etching and plating machines
– **Process control systems**: Automated inspection and testing systems
– **Power management chips**: Integrated into smart connector designs
When automotive semiconductor shortages peaked in 2024-2025, they created a knock-on effect on connector supply chains. Semiconductor fabrication plants prioritized high-margin processors over the mixed-signal chips used in connector manufacturing equipment, delaying equipment deliveries by 40-52 weeks.
This inter-dependency creates a phenomenon industry analysts call “second-order disruption” – where semiconductor shortages don’t just affect electronic devices, but also the equipment needed to produce other electronic components. Container transport logistics further compound this effect, as delayed equipment shipments create production capacity gaps.
1.3 Geopolitical Hotspot Analysis
Different connector manufacturing regions face distinct risk profiles:
**China Mainland (Guangdong/Zhejiang):**
– **Advantages**: Mature manufacturing ecosystem, extensive component supply networks
– **Risks**: Cross-strait tensions, escalating US-China trade restrictions, energy supply volatility
– **Mitigation**: Dual-sourcing strategies, increased buffer inventory for critical components
**Southeast Asia (Malaysia/Thailand/Vietnam):**
– **Advantages**: Lower labor costs, improving infrastructure, trade agreement benefits
– **Risks**: Climate events (monsoons, flooding), political transitions, limited technical workforce
– **Mitigation**: Regional diversity within ASEAN countries, skill development programs
**Mexico (Border Region):**
– **Advantages**: USMCA trade benefits for North American market, proximity to key customers
– **Risks**: Organized crime impact on logistics, water scarcity in key industrial areas
– **Mitigation**: Industrial park security, alternative transportation routes
**Eastern Europe (Czech Republic/Poland):**
– **Advantages**: Skilled engineering workforce, EU regulatory framework stability
– **Risks**: Energy dependency on external sources, regional political tensions
– **Mitigation**: Renewable energy investments, diversified energy supply strategies
A comprehensive risk assessment conducted by major connector manufacturers assigns vulnerability scores to each region. Regions scoring above 75 points on a 100-point scale typically require at least two alternative suppliers or 60-90 days of safety stock.
—
Part 2: Multi-Layered Supply Network Design
The vulnerability of single-threaded supply chains has driven leading manufacturers to adopt multi-layered network architectures that balance efficiency with resilience. Modern Board-to-Board SMT connector supply chains resemble complex ecosystems rather than linear pipelines.
2.1 Supplier Diversification: Beyond Single-Source Dependency
Historical wisdom in electronics manufacturing emphasized selecting the lowest-cost supplier and maximizing order volumes. Today’s reality demands a more nuanced approach:
**Tiered Supplier Strategy**: Leading connector manufacturers now maintain relationships with multiple suppliers at each technology level:
– **Tier 1 (Strategic Partners)**: Primary suppliers handling 40-50% of critical components, deeply integrated into product development cycles
– **Tier 2 (Qualified Alternatives)**: Secondary suppliers providing 30-40% capacity, maintaining production-ready tooling and processes
– **Tier 3 (Emergency Backups)**: Tertiary suppliers with basic qualification, providing 10-20% capacity for critical disruption scenarios
**Technology Portfolio Approach**: Rather than standardizing on a single connector family, manufacturers maintain parallel product lines with equivalent performance but different supplier ecosystems. For example:
– The same 0.8mm pitch connector specification may be produced using different plating technologies (electroless nickel vs. immersion gold)
– Alternative polymer materials (LCP vs. PPA) provide functional redundancy
– Varying contact designs (stamped vs. formed) distribute manufacturing dependency
**Cost Modeling Evolution**: Traditional procurement focused solely on component price. Modern approaches use Total Cost of Ownership (TCO) models that factor in:
– **Risk premium costs**: Insurance and hedging against supply disruptions
– **Logistics complexity**: Multi-region distribution and inventory management costs
– **Quality assurance**: Different supplier performance on defect rates and field reliability
– **Business continuity**: Cost of downtime vs. premium for resilience
2.2 Regional Capacity Balancing: The Triangle Strategy
Geography has become a critical variable in supply chain mathematics. The emerging model organizes production capacity into interdependent regional triangles:
**APAC Production Triangle**:
– **High-volume, mature products** in China for cost efficiency
– **High-mix, complex assemblies** in Malaysia for flexibility
– **Prototyping and R&D** in Singapore for innovation proximity
**Americas Production Triangle**:
– **Low-cost, high-volume** components in Mexico for regional tariff advantages
– **High-complexity precision** manufacturing in Brazil
– **Final assembly and testing** in the United States for quality assurance
**EMEA Production Triangle**:
– **Automotive-grade products** in Czech Republic for automotive proximity
– **Medical/industrial products** in Germany for quality certification
– **Custom/niche products** in Hungary for manufacturing flexibility
This triangular approach reduces transportation distance by approximately 35% compared to centralized manufacturing while maintaining 15-20% capacity buffer across regions. Each triangle operates with some autonomy but maintains connectivity through shared digital platforms and standardized tooling.
2.3 Mathematical Modeling for Buffer Inventories
Inventory optimization has evolved from simple economic order quantity models to sophisticated stochastic programming. Consider a typical automotive connector line:
**Demand Volatility Analysis**: Historical data reveals three distinct demand patterns:
– **Predictable base demand** (approximately 60% of volume) follows seasonal patterns
– **Random volatility** (30% of volume) shows normal distribution characteristics
– **Disruption spikes** (10% of volume) follows Poisson distribution during supply shocks
**Safety Stock Calculation**: Modern safety stock levels incorporate probability-weighted scenarios:
\[ SS = Z \times \sqrt{(LT \times \sigma_D^2) + (D^2 \times \sigma_{LT}^2)} \times M \]
Where:
– \( Z \) = Service level factor (typically 1.65 for 95% service level)
– \( LT \) = Lead time variability
– \( \sigma_D \) = Demand standard deviation
– \( D \) = Average demand
– \( M \) = Multiplier for disruption risk (ranging from 1.2 for stable regions to 2.5 for high-risk regions)
**Real-World Implementation**: A leading connector manufacturer uses this model to determine:
– **Region 1 (Low risk)**: 25-30 days of safety stock
– **Region 2 (Medium risk)**: 45-60 days of safety stock
– **Region 3 (High risk)**: 75-90 days of safety stock, plus 25% capacity reservation in alternative locations
**Buffer Location Strategy**: Rather than concentrating buffer inventory in centralized warehouses, modern networks employ distributed buffer locations:
– **Raw materials**: Maintained at supplier locations with consignment agreements
– **Work-in-process**: Distributed across multiple manufacturing facilities
– **Finished goods**: Placed at regional distribution centers and key customer sites
These mathematically optimized buffers have helped reduce stockout incidents by 78% while increasing inventory turnover from 4.5 to 6.2 times annually.
—
Part 3: Digital Supply Chain Management Transformation
The traditional paper-based, batch-processed supply chain management of the past has evolved into an interconnected digital ecosystem where data flows as freely as materials. For Board-to-Board SMT connector manufacturers, digitalization represents not merely an efficiency enhancement but a fundamental transformation in risk management and operational transparency.
3.1 Predictive Analytics and Artificial Intelligence Implementation
Modern connector supply chains generate petabytes of data from interconnected sources:
– **IoT sensors** on manufacturing equipment track real-time performance metrics
– **RFID tags** on materials provide location and condition information
– **Satellite imagery** monitors ports, transportation hubs, and weather patterns
– **Social media sentiment analysis** detects early warning signs of potential disruptions
**Demand Prediction Evolution**: Leading manufacturers have moved beyond traditional forecasting to implement machine learning models that process over 200 variables, including:
– **Macroeconomic indicators**: GDP growth rates, industrial production indices, currency exchange volatility
– **Industry-specific signals**: Automotive production forecasts, electronics manufacturing orders, semiconductor fab utilization rates
– **Geopolitical factors**: Trade policy changes, tariff announcements, regulatory developments
A recent implementation at a Tier-1 connector manufacturer demonstrates the power of these systems. Their AI platform successfully predicted raw material shortages 67 days in advance, allowing proactive sourcing adjustments that saved over $8.2 million in expedited shipping costs and production delays.
**Anomaly Detection Systems**: Advanced algorithms monitor supply chain performance in real-time, identifying patterns that indicate emerging risks:
– **Transportation delays**: Detecting when shipment transit times exceed historical norms by more than 15%
– **Quality trends**: Identifying subtle changes in material characteristics that precede significant quality issues
– **Financial health**: Monitoring supplier financial metrics to flag potential insolvency risks 90-180 days before bankruptcy
3.2 Blockchain-Based Traceability and Certification
In industries like automotive and medical where product liability and regulatory compliance are paramount, blockchain technology has emerged as a game-changer for supply chain transparency.
**Material Provenance Tracking**: Each connector component embeds a digital twin on a private blockchain that records:
– **Origin verification**: Mine-to-manufacturer material tracing with GPS coordinates and timestamps
– **Processing history**: Temperature profiles during polymer molding, plating chemical composition
– **Quality certifications**: Laboratory test results, third-party verification, RoHS/REACH compliance data
– **Environmental impact**: Carbon footprint calculations, energy consumption metrics, water usage statistics
**Smart Contract Implementation**: Automated agreements embedded in blockchain execute when conditions are met:
– **Automatic payments**: Released to suppliers when quality inspection results confirm specifications
– **Compliance verification**: Regulatory documentation automatically validated and updated
– **Intellectual property protection**: Design patents and manufacturing know-how secured through encrypted access controls
A recent automotive industry consortium reports that blockchain-based traceability has reduced certification time for automotive-grade connectors from 12-16 weeks to just 72 hours while improving auditability and reducing compliance costs by approximately 35%.
3.3 Real-Time Monitoring and Visualization Dashboards
The “control tower” concept has evolved from simple reporting dashboards to interactive command centers that provide supply chain leaders with unprecedented visibility and control.
**Multi-Dimensional Data Integration**: Modern dashboards integrate information from five distinct domains:
– **Operational metrics**: Production output, quality rates, equipment utilization
– **Logistics tracking**: In-transit inventory, port congestion status, customs clearance times
– **Financial indicators**: Cost of goods sold, margin calculations, working capital efficiency
– **Risk assessment**: Geopolitical risk scores, weather patterns, supplier health indicators
– **Sustainability metrics**: Carbon emissions, energy consumption, water usage, waste generation
**Scenario Simulation Capabilities**: Advanced visualization tools allow supply chain leaders to model potential disruptions:
– **”What-if” analysis**: Simulating the impact of a 30-day port closure on regional distribution
– **Recoption path planning**: Identifying optimal alternate routes during transportation disruptions
– **Resource reallocation**: Determining how to redistribute production across multiple facilities
**Autonomous Response Systems**: Beyond visualization, these platforms enable automated responses:
– **Dynamic rerouting**: When a shipment is delayed, the system automatically selects alternative carriers
– **Production recalibration**: When raw material quality deviates, manufacturing parameters adjust automatically
– **Inventory redistribution**: When demand spikes in one region, safety stock is reallocated autonomously
These digital management systems have demonstrated impressive results. A 2025 case study of major connector manufacturers shows that companies with advanced digital supply chain capabilities experienced:
– 45% faster response time to disruptions
– 32% reduction in inventory carrying costs
– 67% improvement in on-time delivery performance
– 28% decrease in expedited shipping expenses
Conclusion
Board-to-board SMT connectors play a critical role in modern electronic systems, from electric vehicles to industrial automation. Selecting the right connector requires careful evaluation of pitch, current rating, signal integrity, and environmental requirements. Longyueda offers a full range of BTB SMT connectors designed to meet these diverse application needs.
Frequently Asked Questions
What is a board-to-board SMT connector?
A board-to-board SMT connector uses Surface Mount Technology to directly solder connector terminals onto PCB pads. It provides a reliable mechanical and electrical connection between two PCBs without cables, supporting high-density designs in compact electronic assemblies.
What pitch sizes are available for BTB SMT connectors?
Common pitch sizes include 0.4mm for ultra-compact devices, 0.8mm for general-purpose electronics, 1.0mm and 1.27mm for industrial applications, and 2.54mm for breadboard-compatible designs. Longyueda offers connectors across all these pitch ranges.
What is the typical current rating for an SMT BTB connector?
Current ratings vary by pitch and pin count: 0.4-0.8mm pitch connectors typically handle 0.5-3A per pin, while larger pitch (1.27-2.54mm) connectors can support 3-5A per pin. Always verify derating guidelines for your specific application.
How to ensure reliable SMT soldering for BTB connectors?
Key factors include proper stencil design for solder paste volume, accurate pick-and-place alignment, optimized reflow profile for the connector material (LCP or PA9T), and AOI for solder joint quality verification.
📡 Download BTB SMT Connector Datasheet & Request Samples →
Explore our board-to-board connector selection guide and 0.8mm BTB connector technical guide for detailed selection information.
